Portola Valley, CA
Home MenuPopular Searches
Local Seismograph
In the Rift Valley of the San Andreas Fault
The seismograph producing this data was designed and built by local volunteers Tor Lund, Ed Bacho, Ted Driscoll, Sheldon Breiner, and Michael Bray (and funded by local contributions).


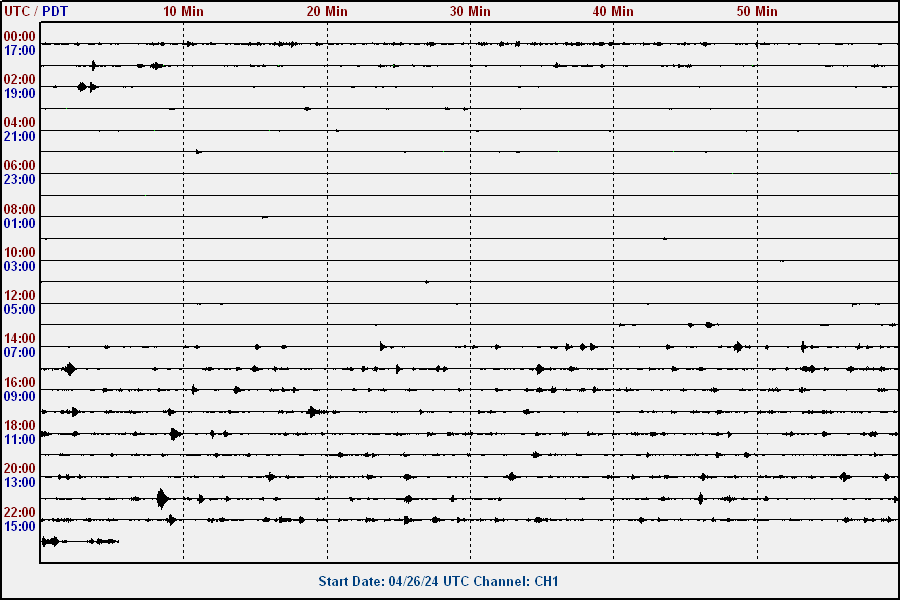
Above are the two output graphs from the seismograph operating in the Historic Resources Room in the Portola Valley Library. This homebuilt seismograph registers ground movement in two orthogonal directions, and each graph plots the movement over time in each of those directions. Typically an incoming seismic wave will trigger both graphs, and by measuring the time and magnitude of each graph it should be possible to determine the direction the wave is coming from.
In the graphs above the previous 24 hours are shown. These graphs are updated on this website about every five minutes (you can refresh the page every few minutes to see the next update). The UTC time (shown in red) is equivalent to Greenwich Mean Time and the local time is shown in blue. The seismograph gets its time signal from the Internet. It is also on a battery backed-up power supply and should stay up during brief power failures. The seismograph should run 24 hours a day uninterrupted. The vertical scale of the traces is not calibrated to any technical scale and should only be viewed as a relative indicator of shake. This seismograph should detect distant major quakes and smaller local quakes. However, in the “big one” on our segment of the San Andreas fault, the seismograph will certainly saturate and likely will be cut off from the Internet for some time. At that time we will have bigger issues to deal with and we won’t need a seismograph to tell us there has been a quake.
